Reflection about our social impact: a collaborative exercise

FeaturedReflection about our social impact: a collaborative exercise

Christmas and New Year’s is a time of reflection for many, including me. It’s a time to return to our core goals, our purpose, and compare it with what we’ve achieved so far. It’s an important thought process to check whether we’re on track to achieving our goals, our purpose.

It’s not always easy to figure out on our own how to better align our actions with our purpose, how to achieve more, how to have a bigger social impact. From my experience, I can only go so far with my own ideas and thoughts. At some point, it’s other people’s perspectives that make the best goals and actions become clear to me.

So, I thought I’d try something collaborative with this blog and invite you to take part.

Here’s the idea: We each share a brief social impact statement (share our purpose), one recent social impact achievement (celebrate one of our successes), and one social impact pledge (commit to one thing we could do better/more of). You can of course do this more comprehensively for yourselves, but for this exercise, let’s keep it simple. In turn, others are encouraged (but not obliged) to comment on previous contributions – e.g. by making a suggestion towards achieving someone else’s pledge.

The benefit of the exercise would be two-fold:

  1. It’s a simple opportunity to help you reflect on your social impact and produce actionable goals for yourselves towards increasing your social impact.
  2. You are inspired by other people’s achievements, get useful tips from others, and share some of your own know-how with your colleagues in the sector.

Two recent clients of mine, The Scout Association and Future First, and me will get the ball rolling:
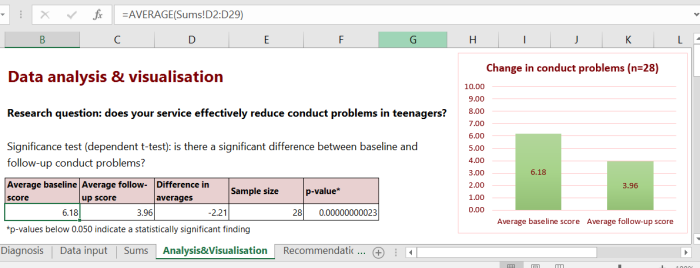
SocStats

Purpose: I want to empower social sector organisations to make better use of data to maintain and increase their social impact.

Achievement: I helped one of my clients figure out what the key attributes of a great boss are based on data from a qualitative survey.

Pledge: I want to further improve my reporting style so that data insights are more easily digestible and feel directly actionable to my clients.

The Scout Association

Purpose: Actively engage and support young people in their personal development, empowering them to make a positive contribution to society

Achievement: With the help of SocStats, we completed our pilot into impact measurement within Scouting, no easy thing when you are a volunteer led, federated, non-time bound intervention.

Pledge: We’ll now take our learning and undertake impact measurement annually, constantly seeking to become more robust so that we can improve our practice, prove our impact and make better decisions as a Movement.

Future First

Purpose: I want to ensure all young people have access to role models they can relate to.

Achievement: I used data from a feedback survey together with usage data from our online tool to make a series of improvements to this system to drive up its usage and mean more young people have access to role models.

Pledge: I want to put in place longer term outcome measurement.


We look forward to your contributions! Please make sure to include your organisation’s name when you leave a comment/reply below.

What are research questions and why are they so important for measuring impact?

What are research questions and why are they so important for measuring impact?

It’s easy to get excited about measuring your impact and collecting all sorts of data. However, you may realise that:

  1. You are missing some important data that should have been collected
  2. Some of the data isn’t helpful (you’ve asked the wrong questions)
  3. Some of the data is unclear (you’ve used the wrong wording in your questions)
  4. Your data doesn’t come together to tell a compelling story

Nailing down your research questions can avoid these problems.

What are research questions?

Research questions put into words what exactly you want to know. They help you focus your research in the planning stages, and help you keep that focus when you are analysing and presenting your data.

Examples are:

  • Does the teacher training we provide result in higher pupil grades?
  • Do pensioners who have received cognitive behavioural therapy (CBT) have improved mental health compared to pensioners who did not receive CBT?
  • Does women’s confidence increase more than men’s after attending a parenting skills programme?

A good research question specifies the following four PICO elements:

  • Population: Whose outcomes (e.g. grades or mental health) are we interested in?
  • Intervention: What is the population receiving that would improve their outcomes (e.g. teacher training or CBT)
  • Comparison (if applicable): Who are we comparing our population to (e.g. pensioners without CBT or men)
  • Outcomes: What outcomes are we measuring (e.g. grades or mental health)?

Top tip: If your organisation has a Theory of Change (a visual model describing what services your organisation provides, what impact these achieve and how they achieve that impact), make sure you use the exact outcomes from your model in your research questions!

How many research questions should I have?

The number of research questions usually depends on the complexity of the research, but broadly speaking you should have no more than one or two primary research questions (the big important ones). You can have many more secondary research questions, but make sure to only use those that are actually important and can be answered appropriately with the available resources. This means having the right data, having enough of it, and having capacity to analyse it all!

Example primary question

  • Does the teacher training we provide result in higher pupil grades?

Example secondary questions

  • Do female pupils benefit more than male pupils?
  • Do pupils from low-achieving schools benefit more than pupils from high-achieving schools?

When should I come up with my research questions?

First thing! Decide on your research questions before you start data collection as they will guide what data will need collecting.

I have already started data collection but don’t have my research questions yet, what do I do?

Not to worry, many organisations have found themselves in this situation already. Decide on your research questions as soon as possible – they can still help focus the remainder of the research and especially the data analysis and reporting processes. If you then come across any of the problems mentioned at the top of this entry, you’ll know how to fix them for the next time you collect data and do some research.


Need help? Email me

How to collect high quality data

How to collect high quality data

You can have the perfect research design, but if the data you collect isn’t good quality, you risk vague, inconclusive or even misleading results. You therefore risk wasting the time and resources you are investing to conduct the research. Here are some tips towards what you can do to make data collection a success:

Thorough planning

How well you plan your data collection is the biggest influencing factor on the quality of your data. Data collection is never simple, and more often than not issues pop up that threaten the quality of the data. Ensure you are prepared for this by planning every detail, for example through drawing up a detailed evaluation plan (create your own or use Project Oracle’s evaluation plan template to get started) and including information on:

  • What information / outcomes will be measured with what tools? Draw up a table or matrix to keep an overview of what data serves what purpose. Make sure these are aligned with your research questions (the 1-3 key things you want to learn with your research project).
  • Who is in charge of coordinating data collection? Ensure there’s someone to drive and take responsibility for the data collection.
  • When exactly will data be collected? This may differ by outcome / tool. Set clear and realistic dates and define follow-up periods where relevant.
  • Who will collect the data? Again, this may differ by outcome / tool. Have multiple conversations with potential data collectors to understand who would be suitable and available. Make sure the data collectors’ roles do not involve a potential conflict of interest that could affect or skew the data.
  • Who will you be collecting data from? Clearly define your target population (e.g. age, geographical area, ethnicity etc.) to ensure you collect data from the right people.
  • What will you do to keep response rates high? Come up with 2-3 strategies that feel suitable for your circumstances. This could involve sending reminders to participants, providing incentives (e.g. free lunch), removing barriers (e.g. providing assurances to counteract participants’ potential anxieties), or minimise required effort (e.g. a quick link to an online survey instead of a paper survey).
  • How and where will the gathered data be stored? Ensure it is a safe place with restricted access to guarantee that data confidentiality cannot be breached. Ensure it is labelled accurately to avoid confusion, particularly later down the line. Ideally arrange it so it is easy to navigate and compile for data analysis.
  • What kinds of analyses will be possible and appropriate for the data? This is important to inform your research design (e.g. if you need a comparison group or not). Try to be as specific as possible. Ask a data analyst or statistician if you’re not sure.

When you have your plan, ask someone with research experience to sense-check it. They may just find a gap in your plan or have a good idea or two on how you can improve it.

Use appropriate, accurate and reliable measurement tools

Whether they are surveys (click here to read about what makes a good survey tool), databases, interviews, focus groups or other types of data collection tools, they should be scrutinised for their suitability to reliably capture the insights you’re after. The easiest way to ensure your tool is reliable is to use a validated tool – a tool that has already been scientifically tested for its accuracy and reliability. They usually provide a variable called Cronbach’s alpha which tells you how reliable that tool is. As a rough guideline, a tool needs to have a Cronbach’s alpha of at least 0.70 to be deemed acceptable. However, if no validated tool is available for your project, it is advisable that you test your own tools before use – e.g. by collecting feedback from a test group of your service users on how appropriate it is, and by checking how meaningful the test data is towards answering your project’s research questions.

Ensure staff buy-in and preparedness

Take time to ensure your staff understand and ideally believe in the value of collecting data. Ensure they are clear about the exact process and their responsibilities in it, and that they are sufficiently resourced and trained to fulfil those responsibilities. Ensure they know how important it is to flag data collection issues, and who to speak to about any such issues.

Avoid changing your data collection approach half-way through the research project

No data collection approach is perfect, but changing it after data collection has begun usually does more damage to the quality of the data than sticking with a somewhat flawed approach. In fact, some flaws can be ironed out at the analysis stage.

Automate your data entry

By using online surveys or digital data entry templates, you can save substantial amounts of time on data entry. Similarly, you can drastically reduce the chance of inconsistencies occurring in the data (e.g. typos) and avoid needing more time to clean the data before it can be analysed.

Conduct data quality checks

Periodically review a sample of the incoming data to ensure you notice data problems as early as possible. This will allow you to act before these problems substantially damage the quality of your final dataset.


If you have any questions on any of the above tips, would like some help with your data collection plan, or would like to share your own tips from your experience with data collection, get in touch!

Get your downloadable version of this blog resource here!

Excel reports: a simple way to automate your analysis & reporting

Excel reports: a simple way to automate your analysis & reporting

Rahel Spath, Founder of SocStats & Haile Warner, Evaluations Manager at Project Oracle

Automated Excel reports go by many names – funder report templates, Excel database, auto-calculation spreadsheets and many more. Regardless, they are all created with one goal: to extract valuable insights from data and present the findings in a useful format. But how effective are they in achieving this goal, and what are the steps you can take to produce an efficient automated Excel report?

First off, what is an automated Excel report?

An automated Excel report is a Microsoft Excel file that automatically analyses your data. It usually involves a section for data input and a section for displaying the results of the analyses. For instance, you may have one ‘data input’ tab where you can enter your SDQ[1] survey data then, once your data is entered, a second ‘analysis and visualisation’ tab will automatically analyse the results. This will provide group averages and even includes significance tests to determine whether your results are credible. It can also produce various graphs, e.g. a before-and-after bar chart to visualise how your participants changed over time.

What does it look like?

The example below shows you the tab where the data is automatically analysed and visualised. It draws on data from the earlier ’data input’ tab, where the data from an SDQ survey is stored.

Excel report example

Pros and cons

The table below can help you decide whether an automated Excel report could be the right solution for you:

Pros Cons
  • It’s a low-cost solution
  • Little to no analysis expertise is needed to operate it
  • Most staff have the necessary MS Excel skills to operate it
  • It saves time on repeated analyses
  • It can produce tables and graphs useful for reporting
  • It can even have a fully-equipped report tab
  • It can be branded as desired
  • If the data is quite messy, the report may not work sufficiently well
  • If changes are required, outside expertise may be need to be hired
  • If used incorrectly, it can produce misleading results
  • Staff with little to no analysis expertise may misinterpret findings
  • It is not as elegant as other analysis/reporting solution

Case study

Project Oracle worked with a large performing arts charity to help them manage data accumulated over several years. They use a range of tools to collect data on whether the programme was delivering its intended outcomes for young people. This included surveys they had designed themselves and validated questionnaires designed by academics. Once the data was collected, it simply sat in spreadsheets. Staff did not have the time or skills to analyse and use the data. But funders and other stakeholders wanted more detailed evidence that the programme was having an impact.

Oracle_new-small-low-quality2Project Oracle supported the organisation to create an automated Excel report, which automatically generated complex analyses as soon as the data was entered. This included summaries of how each group of young people was progressing, and graphs which could be used for reports. In addition, statistical significance testing was used to provide a robust indication of the effect the programme was having. Individual progress could also be viewed through helpful colour-coding of individual data.

The system has streamlined the reporting of data, and made it possible for the organisation to make statements about the effectiveness of their work which are backed up by strong evidence.

How can I make my own automated Excel report?

1. Make a plan: Figure out…

  • What information your report should be able to give you?
  • What sort of data you need to provide this information?
  • What measurement tools you will employ to collect the data you need?

2. Build it:

If you have the Excel & analytical expertise in-house, create the following:

  1. Data input tab(s): Create one (or if necessary, several) data input tab(s). This is where you input or import the data that you want to analyse and report on – e.g. your raw SDQ survey data.
  2. Data analysis tab: Create a new tab in the same Excel file, and start the data analyses you need for your report using the data in your data input tab(s). This might involve simple tables describing the data (e.g. averages) or more complex formulas (e.g. t-tests) – similar to what you can see in the example above. Thus, this tab will automatically update itself when you input new data into the first tab.
  3. Data visualisation tab: If you will use the Excel file simply to produce figures and some useful graphs for a non-Excel report, you can just create these inside the data analysis tab (e.g. like in the example above). However, you can also create a full report in a new tab where can apply your branding and arrange the analysis results and graphs in a visually appealing manner. The figures and graphs can be directly linked to the data analysis tab so they update themselves automatically when you input new data into the first tab.

If you don’t have the necessary expertise in-house, get someone else to build it for you, e.g. SocStats (website | email). They can also help you with the planning.

[1] The Strengths and Difficulties Questionnaire (SDQ) is a brief behavioural screening questionnaire for 3-16 year olds.

Bad Survey Checklist

Bad Survey Checklist

Surveys are a very common data collection method, but far from the easiest. When you’re setting up a survey to collect data, there are many, many things that can go wrong – even if you’re using a validated survey (surveys that have been carefully developed, scientifically tested and can guarantee high quality data). Fortunately, with a bit of care you can ensure you avoid these pitfalls. To name just a few:

  • Ending up with less data than hoped – e.g. because you sent your survey out on a Friday afternoon when few have energy left to respond, or because your survey invitation went straight into your respondents’ junk mail boxes
  • Ending up with data that doesn’t provide you with clear answers to your research questions – e.g. because you haven’t agreed a clear purpose and research questions with your colleagues in advance of collecting survey data
  • Ending up with inaccurate or skewed data – e.g. because respondents don’t understand your question, or because the question wording influences the respondent to answer in a less accurate way (e.g. through leading questions)
  • Ending up with the wrong type of data for your analyses – e.g. narrative data when you need numerical data
  • Ending up with lots of missing data – e.g. because you are scaring off respondents with intrusive questions early on, or because your respondents start skipping questions because your survey is too wordy or long

Bad data isn’t just frustrating, it’s very time-consuming to deal with.

Take your survey and compare it with the freely downloadable checklist provided here – how does it compare and what can you do to avoid getting bad data?

Download the Bad Survey Checklist here and get your survey right.

The powers of data

The powers of data

Today, it is difficult getting by in the social sector without data as it plays an ever more important role in decision-making.

There are three key reasons for collecting data about your organisation – to track progress, to learn, and to improve your service.

1 – Tracking progress

This is the part that will interest your funder the most – what have you achieved with their investment? What can future funders expect from an investment into your organisation? While this may not be your top priority, it is top priority for the sustainability of your service. Tracking progress is also the part that helps you organise your work on a day-to-day basis. It keeps your eyes on the goals and helps you prioritise.

2 – Learning

Learning is about understanding better what practices are key to make a true difference with your service and what impact you are having on your beneficiaries.

3 – Improving your service

You can use your knowledge from your learning and tracking progress to further improve your service. This may be as simple as colleagues sharing best practice amongst each other. It could also be finding ways to adapt your service to better serve your beneficiaries based on your knowledge of what has and hasn’t worked for your beneficiaries so far.

So, in sum, data has the following powers:

  • Sustainability: impress your funders
  • Learning: learn more about what works and what doesn’t
  • Effectiveness: make your service more effective
  • Efficiency: run your organisation more efficiently

However, you need high quality data – bad data may not benefit you in any of the above ways. Here’s eight tips towards making data an effective tool in your organisation:

  1. Prioritise: What data do you really need? In light of limited budgets and capacity, it’s crucial to focus on collecting data that will serve its purpose well. Strip away the nice-to-haves if you can’t afford them. Quality over quantity.
  2. Plan smart: How can you get high quality data? High quality data is really tricky to obtain, even for seasoned researchers, so plan well and in detail, pick reliable measurement tools and know how you will mitigate data collection problems. Your efforts here will pay off.
  3. Transparency: Are you including even data that may not show you in the best light? Only when you are completely transparent can you and your colleagues learn from the data. Playing down unflattering data helps nobody, least of all your beneficiaries.
  4. Teamwork: Do people understand why they are spending time on data? Ensure you communicate the purpose of the data work with all relevant staff, both to get their insight and to get their buy-in. If you miss either, your data will suffer.
  5. Meaningful analysis: How will you analyse the data? Make a plan even before you collect the data. Pick an approach that makes the best use of the data. Be robust when you conduct the analyses. If you don’t have the expertise, outsource it.
  6. Purposeful reporting: What data really matters? Put yourself into the shoes of your audience – what do they want to know? How will your report be useful to them? Don’t focus on reporting what’s important to you, but what’s important to them.
  7. Professional reporting: Does your data reporting look trustworthy to knowledgeable readers? Ensure your report is sufficiently structured, free from typos and looks credible to your audience. Don’t forget your sample sizes in an evaluation report.
  8. Apply the learning: When a report has been written, do you have a clear plan how you will use the learning internally? Agree clear actions with your colleagues. The report shouldn’t just be an intellectual exercise.

Working with data isn’t easy, but if you do it right, its powers will be your powers.


Guest blog: Janet Anthony with “5 Tips How to Write Data Analysis Plan”

Guest blog: Janet Anthony with “5 Tips How to Write Data Analysis Plan”

Check out Janet Anthony’s blog post on how to write your data analysis plan. Her tips are really useful for anyone who is collecting or planning to collect data – not just for data analysts.

Why bother with a data analysis plan?

“A good data plan can save your research. And it’s not even that hard to draw up. Just sit down and think logically about what you’re measuring and why, as well as where it belongs in your design. In this way, you can avoid the errors before they happen. And that’s important, as it can be incredibly hard to fix them afterward.”

Her post includes these 5 tips:

  • Work out how many people you need
  • Draw up the tables and figures you want
  • Map out all your variables
  • Think about mediators and moderators
  • Make sure you granulate your variables

Each point is very clearly explained – you don’t need to be a research geek to benefit from them!

If you need any help with your data plan, email me on rs.socstats@gmail.com

Why report analysed data over just reporting averages / percentages?

Why report analysed data over just reporting averages / percentages?

There are two ways you can present your data when you are done measuring the impact of your service. Let’s say your organisation is trying to reduce offending rates in young adults.

  1. The simple method
Before using your service After using your service
Average number of offences per person 8.3 per year 6.4 per year

The data shows that our young adults commit on average two fewer offences per year after using the service.

  1. The thorough way
Before using your service After using your service (2 year follow-up) Difference in averages Sample size at both times* Significance of difference in averages#
Average no. of offences per person per year 8.3 6.4 1.9 76 p = 0.034

* only counting young adults for whom data at both points is available

# p-values below 0.050 indicate a statistically significant finding

We have collected offending data for 112 young adults before they started using the service (at referral) and after using the service (two years after service start). Of these, 76 provided data at both times (see appendix for a breakdown of reasons for the loss of the data for 36 young adults). When referred, these 76 young adults had committed an average of 8.3 offences per person per year. At two-year follow-up, they had committed an average of 6.4 offences per person per year, 1.9 offences less than before using the service. A significance test (dependent t-test) concluded that this difference is a statistically significant positive finding, i.e. unlikely due to chance fluctuations in the data.

Which of the two ways is more beneficial? Which of the two ways will your audience prefer? Which of the two will impress your funders more?

The thorough method has the following benefits:

  • You can tell whether a positive or negative finding is statistically significant (reliable, or not due to chance), which makes the report considerably more robust.
  • The robustness of the results can provide investors with confidence that it is worth investing in your service.
  • Your research will be taken more seriously, even by academics.

You can upgrade your reporting without much difficulty. You can create similar tables for your own data, and describe it like in the above example. The analysis (the significance test) is often relatively simple and can be done by your in-house analyst or your freelance data analyst.

Key take-aways for good impact reporting:

  • Report your sample sizes
  • Describe your data in sufficient detail (e.g. follow-up period)
  • Conduct appropriate analyses (e.g. a significance test) instead of just reporting averages

Any questions? Need an analyst to support you in your impact reporting? Email me on rs.socstats@gmail.com